
Liste des villes et communes du Territoire de Belfort
Liste complète des communes, cantons, bassins de vie, intercommunalités du Territoire de Belfort.
NOTE : Le département du Territoire de Belfort comporte 1 communes nouvelles :
 Voir les communes nouvelles du Territoire de Belfort
 Voir toutes les cartes du Territoire de Belfort
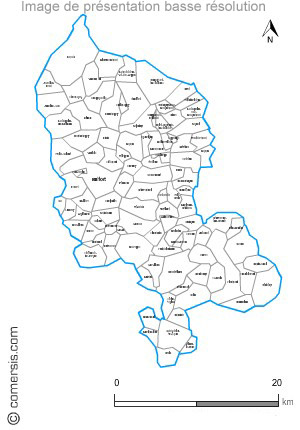
Liste des 101 villes et communes du Territoire de Belfort au 1er janvier 2026
| nom | cp | arrdt | canton | EPCI  |
pop | lat. | long. | alti | surf |
|---|---|---|---|---|---|---|---|---|---|
| Essert | 90850 | 1 | Bavilliers | CA Grand Belfort |  3382 | 47.63389 | 6.81556 | 360 | 7.11 |
| Chèvremont | 90340 | 1 | Châtenois-les-Forges | CA Grand Belfort |  1566 | 47.62833 | 6.92389 | 350 | 8.77 |
| Montreux-Château | 90130 | 1 | Grandvillars | CA Grand Belfort | 1167 | 47.60917 | 7.00389 | 352 | 4.67 |
| Trévenans | 90400 | 1 | Châtenois-les-Forges | CA Grand Belfort | 1290 | 47.57083 | 6.86333 | 340 | 6.05 |
| Cravanche | 90300 | 1 | Bavilliers | CA Grand Belfort | 1935 | 47.65306 | 6.83028 | 389 | 1.24 |
| Lagrange | 90150 | 1 | Grandvillars | CA Grand Belfort | 139 | 47.68111 | 6.98111 | 370 | 0.90 |
| Cunelières | 90150 | 1 | Grandvillars | CA Grand Belfort | 344 | 47.62806 | 6.99528 | 354 | 2.03 |
| Danjoutin | 90400 | 1 | Bavilliers | CA Grand Belfort | 3531 | 47.61611 | 6.86444 | 356 | 5.55 |
| Larivière | 90150 | 1 | Grandvillars | CA Grand Belfort | 278 | 47.67417 | 6.99806 | 360 | 4.86 |
| Denney | 90160 | 1 | Valdoie | CA Grand Belfort | 762 | 47.65917 | 6.91694 | 350 | 3.62 |
| Dorans | 90400 | 1 | Châtenois-les-Forges | CA Grand Belfort | 823 | 47.58805 | 6.83833 | 362 | 3.80 |
| Eguenigue | 90150 | 1 | Grandvillars | CA Grand Belfort | 270 | 47.67083 | 6.93417 | 360 | 2.50 |
| Éloie | 90300 | 1 | Valdoie | CA Grand Belfort | 954 | 47.69111 | 6.87417 | 400 | 5.52 |
| Novillard | 90340 | 1 | Grandvillars | CA Grand Belfort | 309 | 47.60611 | 6.97167 | 355 | 3.88 |
| Sermamagny | 90300 | 1 | Valdoie | CA Grand Belfort | 945 | 47.69139 | 6.83667 | 402 | 7.97 |
| Évette-Salbert | 90350 | 1 | Valdoie | CA Grand Belfort | 2022 | 47.67722 | 6.80083 | 400 | 9.20 |
| Lacollonge | 90150 | 1 | Grandvillars | CA Grand Belfort | 234 | 47.66472 | 6.96028 | 360 | 1.92 |
| Roppe | 90380 | 1 | Valdoie | CA Grand Belfort | 1042 | 47.66945 | 6.91889 | 360 | 7.57 |
| Sevenans | 90400 | 1 | Châtenois-les-Forges | CA Grand Belfort | 696 | 47.58611 | 6.86611 | 341 | 2.04 |
| Vauthiermont | 90150 | 1 | Grandvillars | CA Grand Belfort | 220 | 47.68417 | 7.03333 | 395 | 4.83 |
| Fontaine | 90150 | 1 | Grandvillars | CA Grand Belfort | 601 | 47.65805 | 6.99667 | 363 | 6.99 |
| Fontenelle | 90340 | 1 | Grandvillars | CA Grand Belfort | 135 | 47.62194 | 6.95583 | 350 | 1.79 |
| Foussemagne | 90150 | 1 | Grandvillars | CA Grand Belfort | 885 | 47.63556 | 7.00556 | 356 | 5.05 |
| Frais | 90150 | 1 | Grandvillars | CA Grand Belfort | 237 | 47.64583 | 6.98750 | 353 | 2.78 |
| Pérouse | 90160 | 1 | Bavilliers | CA Grand Belfort | 1199 | 47.63694 | 6.89306 | 375 | 4.89 |
| Urcerey | 90800 | 1 | Châtenois-les-Forges | CA Grand Belfort | 253 | 47.60778 | 6.80889 | 368 | 3.35 |
| Bethonvilliers | 90150 | 1 | Grandvillars | CA Grand Belfort | 237 | 47.68111 | 6.96333 | 381 | 1.92 |
| Angeot | 90150 | 1 | Grandvillars | CA Grand Belfort | 353 | 47.69667 | 7.01472 | 367 | 6.59 |
| Meroux-Moval | 90400 | 1 | Châtenois-les-Forges | CA Grand Belfort | 1420 | 47.59583 | 6.89639 | 360 | 8.78 |
| Argiésans | 90800 | 1 | Châtenois-les-Forges | CA Grand Belfort | 595 | 47.60583 | 6.82444 | 350 | 2.79 |
| Autrechêne | 90140 | 1 | Grandvillars | CA Grand Belfort | 279 | 47.59472 | 6.95917 | 350 | 2.95 |
| Vétrigne | 90300 | 1 | Valdoie | CA Grand Belfort | 647 | 47.66917 | 6.89750 | 370 | 2.44 |
| Phaffans | 90150 | 1 | Grandvillars | CA Grand Belfort | 429 | 47.66028 | 6.93722 | 360 | 3.25 |
| Banvillars | 90800 | 1 | Châtenois-les-Forges | CA Grand Belfort | 290 | 47.59195 | 6.81556 | 358 | 4.67 |
| Bavilliers | 90800 | 1 | Bavilliers | CA Grand Belfort | 4641 | 47.61972 | 6.83222 | 356 | 4.74 |
| Méziré | 90120 | 1 | Grandvillars | CA Grand Belfort | 1268 | 47.53500 | 6.91944 | 342 | 3.88 |
| Belfort [3] | 90000 | 1 | Belfort | CA Grand Belfort | 45646 | 47.64222 | 6.85583 | 361 | 17.09 |
| Bermont | 90400 | 1 | Châtenois-les-Forges | CA Grand Belfort | 373 | 47.58083 | 6.85361 | 350 | 2.76 |
| Bessoncourt | 90160 | 1 | Grandvillars | CA Grand Belfort | 1304 | 47.64528 | 6.93389 | 355 | 7.94 |
| Andelnans | 90400 | 1 | Châtenois-les-Forges | CA Grand Belfort | 1123 | 47.60278 | 6.86472 | 350 | 4.17 |
| Offemont | 90300 | 1 | Valdoie | CA Grand Belfort | 4054 | 47.66444 | 6.87889 | 370 | 5.52 |
| Botans | 90400 | 1 | Châtenois-les-Forges | CA Grand Belfort | 248 | 47.59694 | 6.85028 | 355 | 2.34 |
| Petit-Croix | 90130 | 1 | Grandvillars | CA Grand Belfort | 305 | 47.61361 | 6.97667 | 350 | 3.80 |
| Bourogne | 90140 | 1 | Châtenois-les-Forges | CA Grand Belfort | 1737 | 47.56222 | 6.91972 | 343 | 13.91 |
| Reppe | 90150 | 1 | Grandvillars | CA Grand Belfort | 324 | 47.66139 | 7.02722 | 369 | 3.88 |
| Menoncourt | 90150 | 1 | Grandvillars | CA Grand Belfort | 391 | 47.67083 | 6.94778 | 376 | 4.69 |
| Buc | 90800 | 1 | Châtenois-les-Forges | CA Grand Belfort | 243 | 47.61528 | 6.78556 | 380 | 2.46 |
| Charmois | 90140 | 1 | Châtenois-les-Forges | CA Grand Belfort | 371 | 47.57278 | 6.94000 | 334 | 4.17 |
| Châtenois-les-Forges | 90700 | 1 | Châtenois-les-Forges | CA Grand Belfort | 2637 | 47.55861 | 6.85000 | 340 | 8.69 |
| Valdoie | 90300 | 1 | Valdoie | CA Grand Belfort | 5193 | 47.66722 | 6.84250 | 375 | 4.72 |
 Plus d'information sur le département du Territoire de Belfort - Insee.
Source: Insee.fr
[ 3 ] commune chef-lieu de département
[ 4 ] commune chef-lieu de région
Évolution de la population légale 2025 par rapport à 2020.
Carte des villes et communes du Territoire de Belfort
Carte personnalisable des communes du Territoire de Belfort, imprimable grand format. Voir cette carte